The Boston real estate feeding frenzy that began in earnest in 2011 has, amazingly, continued in the first half of 2018. Demand for prime residential assets
in our core urban environment would appear to be insatiable if one looks from a high level.
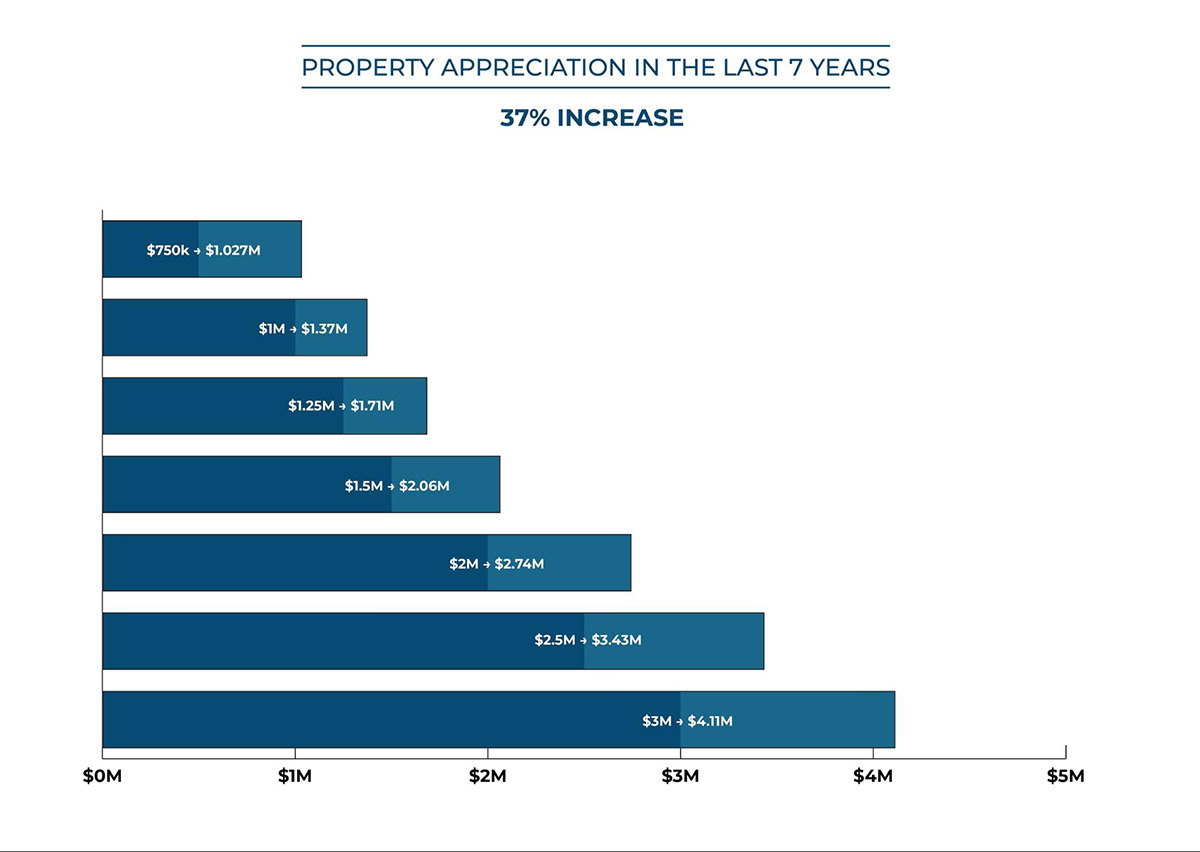
In the first half of 2011, the average per square foot price in Boston’s urban core (Back Bay, South End, Beacon Hill and Downtown Crossing) for properties
that sold for more than $1 million was $892. In 2018, the average price per foot across these markets has reached $1,221. That’s a 37 percent pricing
increase over 7 years.
To drive the point home, here’s a table of expected property appreciation in the last 7 years.
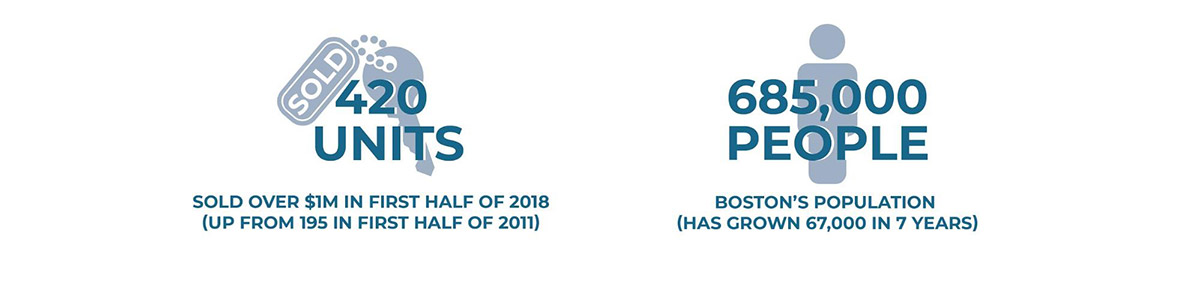
Looking at the four neighborhoods together, there were 195 sales over $1M in the first half of 2011. In the first half of 2018, there were 195 sales over
$1M in the South End alone. The entire area had 420 sales, 2.15x as many as 7 years ago. Between 2010 and 2018, it is estimated that Boston’s population
has grown by over 67,000 to 685,000+ people.
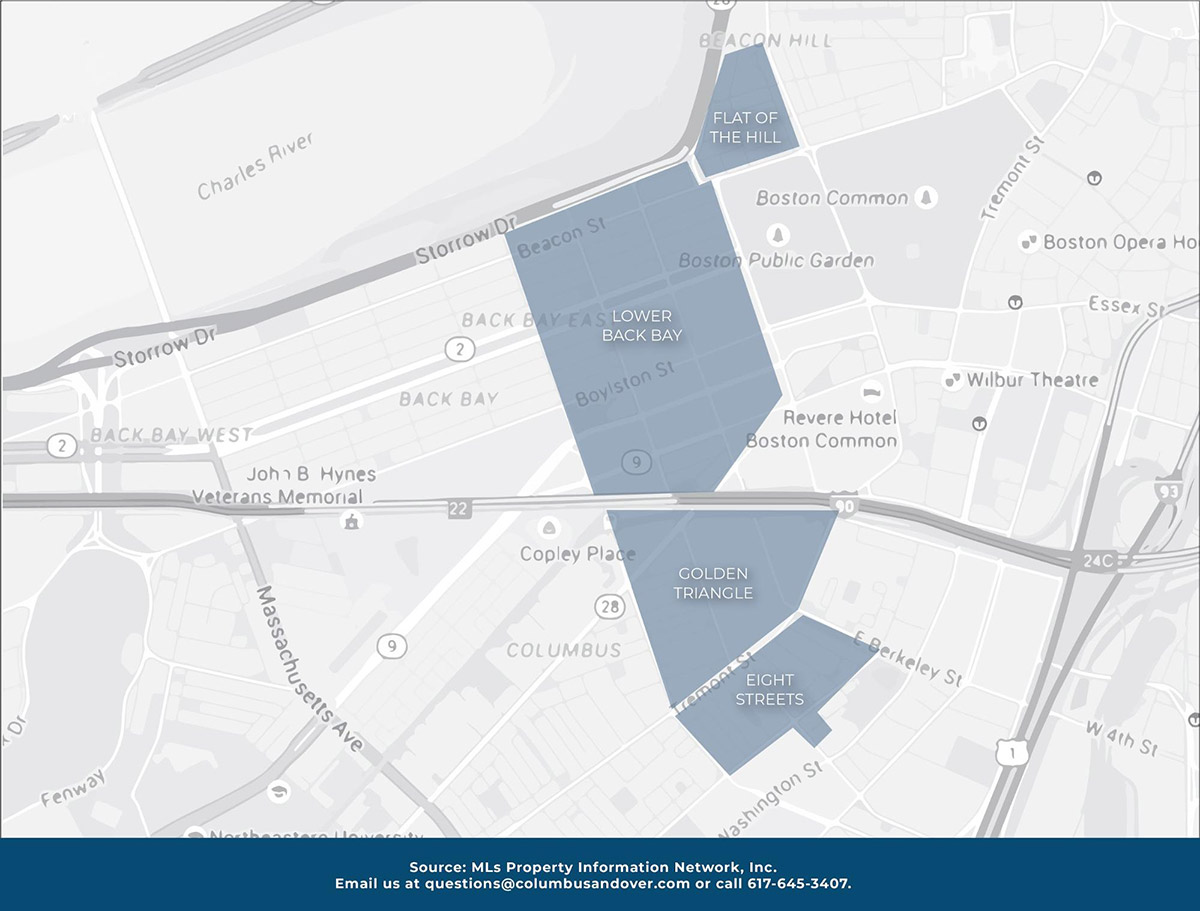
Empirically, we have noticed a particular rush on smaller units in so-called “A+” locations: Lower Back Bay, the Golden Triangle,
Eight Streets and the Flat of Beacon Hill.
900-1,200 SF two bed units have been outperforming the market on a price per square foot basis with a plethora of comps significantly exceeding market
averages. We note an attitude among buyers that they’re willing to pay a premium to get a premium address. Slightly less desirable addresses are, consequently,
taking a seemingly undeserved hit. In other words, there is a flight to quality that puts a premium on the best properties and a disproportionate discount
on those that may be incrementally less “convenient.”
Despite the headlines of continued hotness in the markets, the average price per foot across these four neighborhoods receded (negligibly) in the first
half of 2018 versus the first half of 2017. Average price per foot dropped to $1,221 from $1,238 year over year. We would suggest that those premium
addresses noted above increased in value while lesser known addresses kept the market seemingly on par pound for pound.
The conversation around interest rate increases continues to be a “go to” for consumers and market experts alike. Half way through 2018 there have been
two Fed rate hikes with indications there may still be two more this year. Logic says that the rising rate environment would curtail property appreciation
in our markets over the next 6 to 12 months. However, the economy is strong in general and particularly deep in Boston and we’re hard pressed to bet
against this city in the near term.
That said, globally, concerns in the luxury markets are real and have been fairly well documented from New York to Sydney. One category we have been watching
closely is “days to offer.” This counts the number of days it takes to procure an offer from when a property is listed.
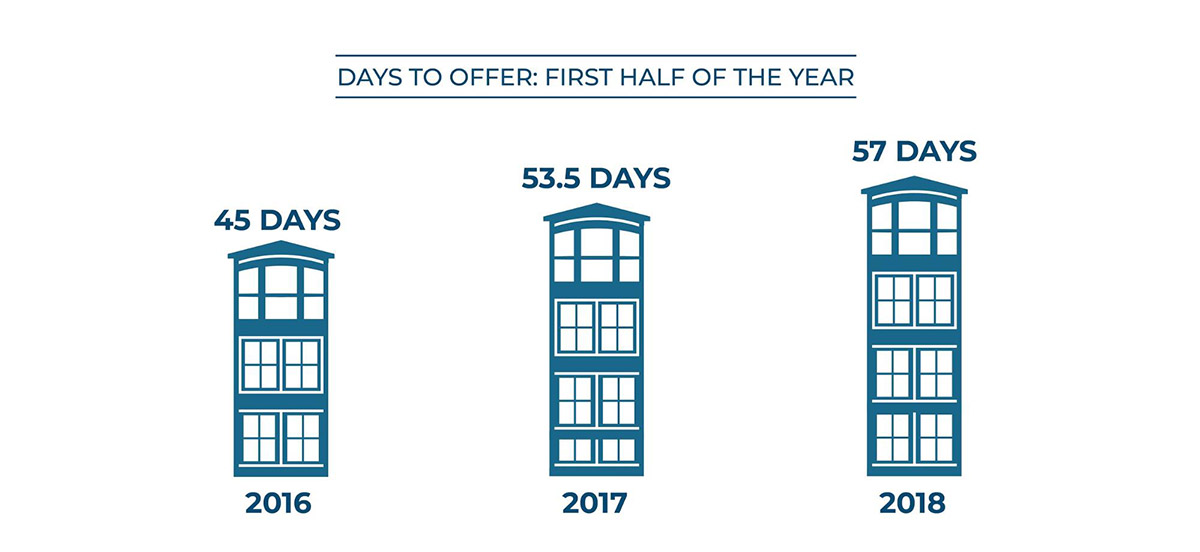
While not huge changes, the growth of this number over the last two years does demonstrate that additional housing supply in the market will cause marketing
periods to lengthen and may force sellers who need to move faster to accept lower offers.
We’re keeping our eye on things as new construction and new price points continue to emerge in Boston. Always let us know if you’d like to get into any
specific numbers together.