With the possible exception of May, April is unlike any other month in our real estate calendar… we start eyeballing it when the calendar rolls
over to a new year and wait anxiously for warmer days to grace our presence. Inevitably, for sale housing inventory transitions from a trickle in the
first quarter to more of a rain shower in April. Steadier listing volume gives increasing numbers of buyers the chance to land in a new home by the
summer months.


As consistent as April inventory traditionally is, 2019’s calendar was slightly unique in the sense that Patriot’s Day (and school vacation week) converged
with Easter weekend. This created a momentary bottleneck in the real estate calendar and the week of April 22nd gave us a relative deluge of listings
to sort through in our core downtown markets. Mortgage interest rates have reassuringly returned to very attractive levels (after a brief spike in
the fourth quarter of 2018) and buyers proved ready. Any property that was priced “fairly” and under $1.5M has quickly identified a buyer and typically
had multiple parties bidding on it. The rhetoric in the brokerage community is that while multi bid offers are still normal the number of offer submissions
has lessened. Whereas we may have seen 6 to 10 offers for a $1M property in previous years, 2019 is seeing more like 3 to 5 offers for the same unit.
SOUTH END SUB-NEIGHBORHOOD $2M+ SALE LOCATIONS IN 2019:
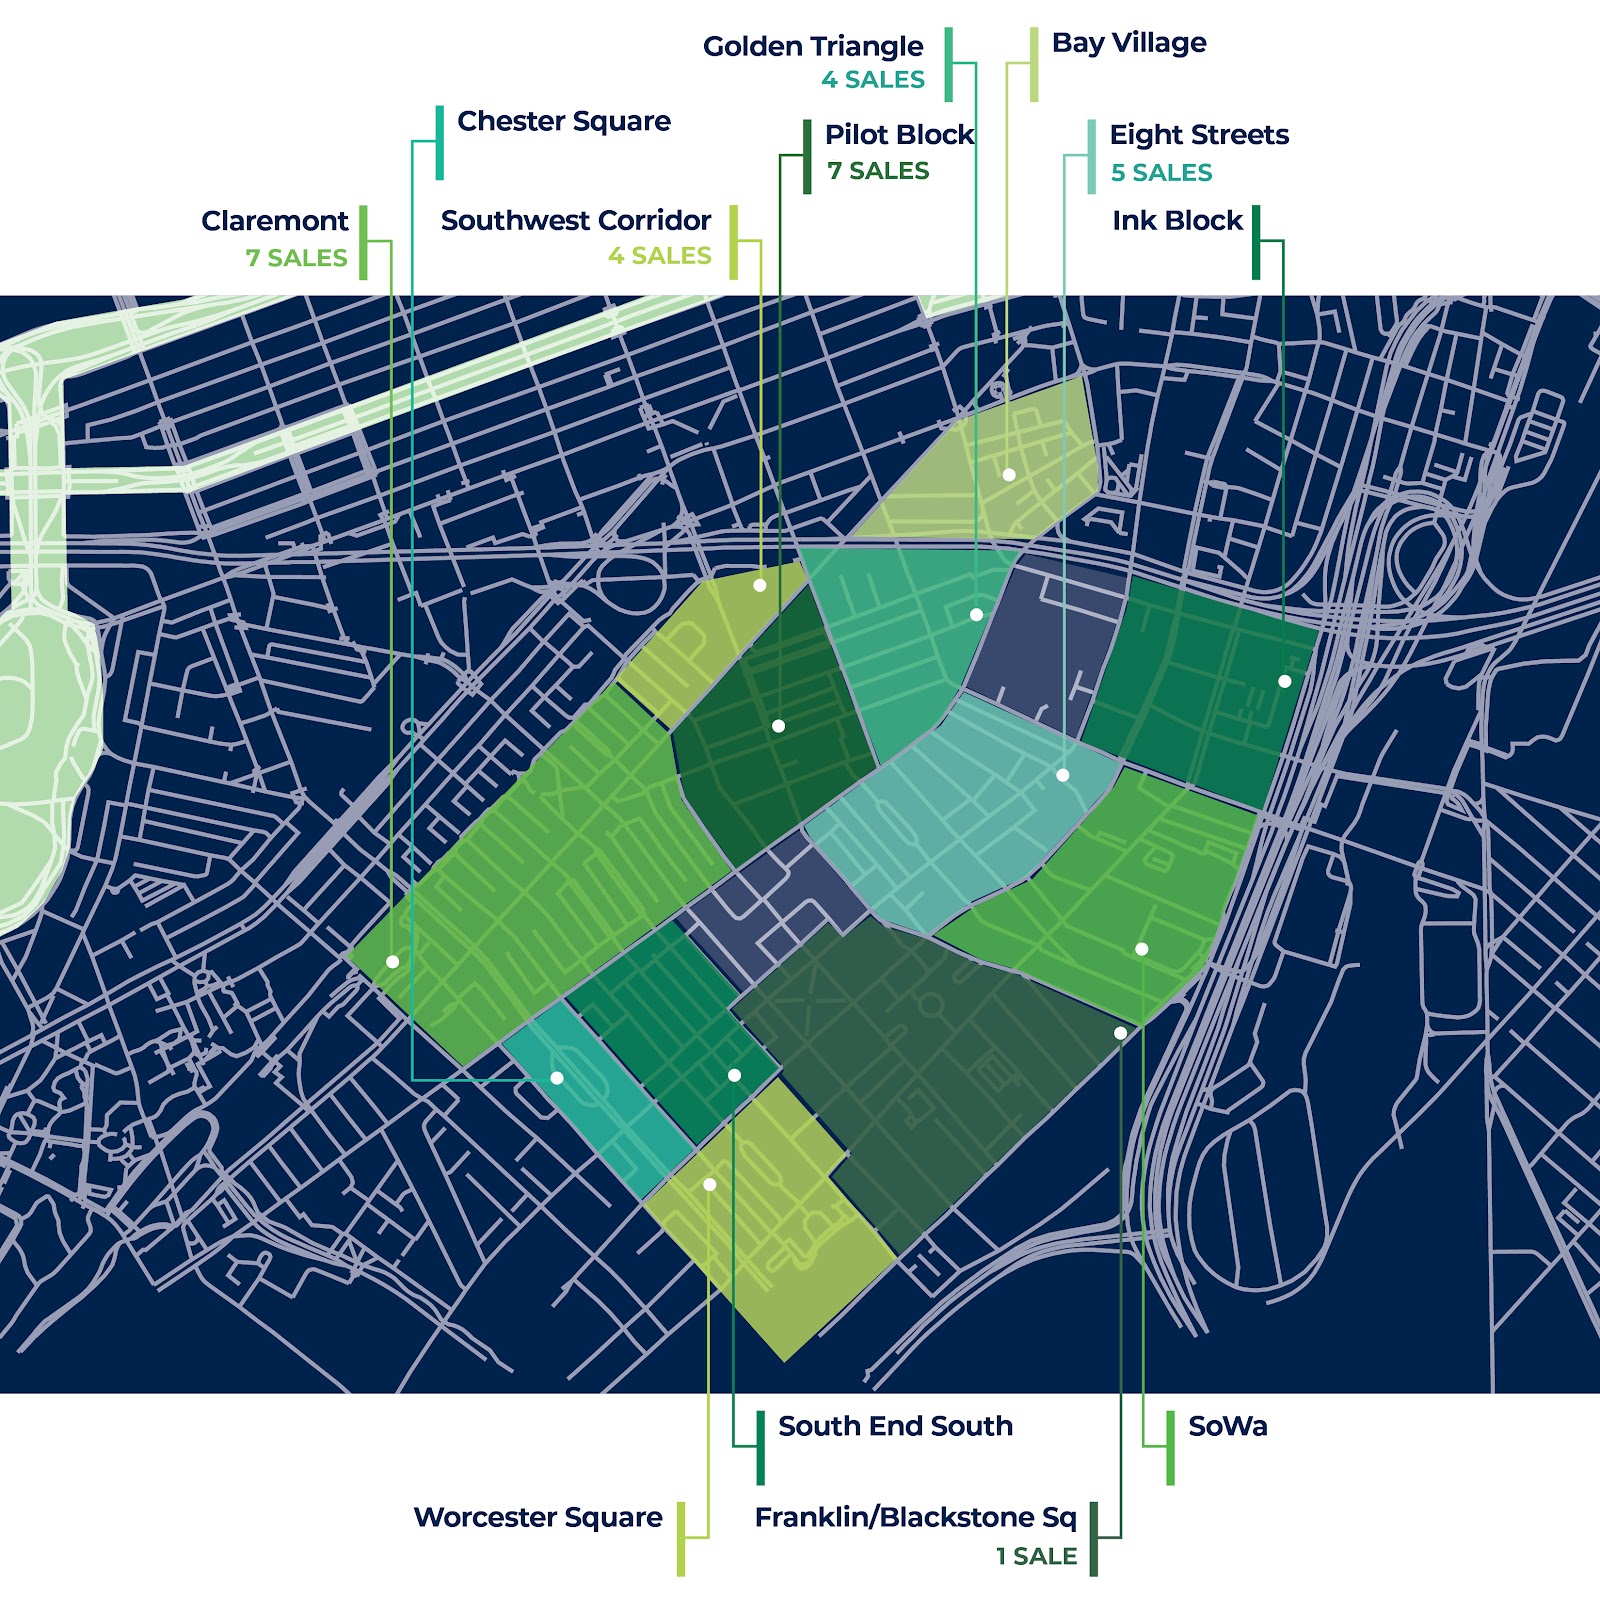
So, 2019 feels different but do the numbers tell that story? Looking specifically at the high end of the market in the South End ($2M+), we had an 18 percent
reduction in the number of transactions from January 1 through the first week in May (28 sales versus 34 sales) for 2019 against 2018. Similarly, sales
($) volume was down 12.5% in 2019 versus 2018 for the same time period. The lesser reduction in dollar volume was in part due to the largest, single
residential sale in the South End’s history: a $6.65M deal at 26 Holyoke Street in the Southwest Corridor.
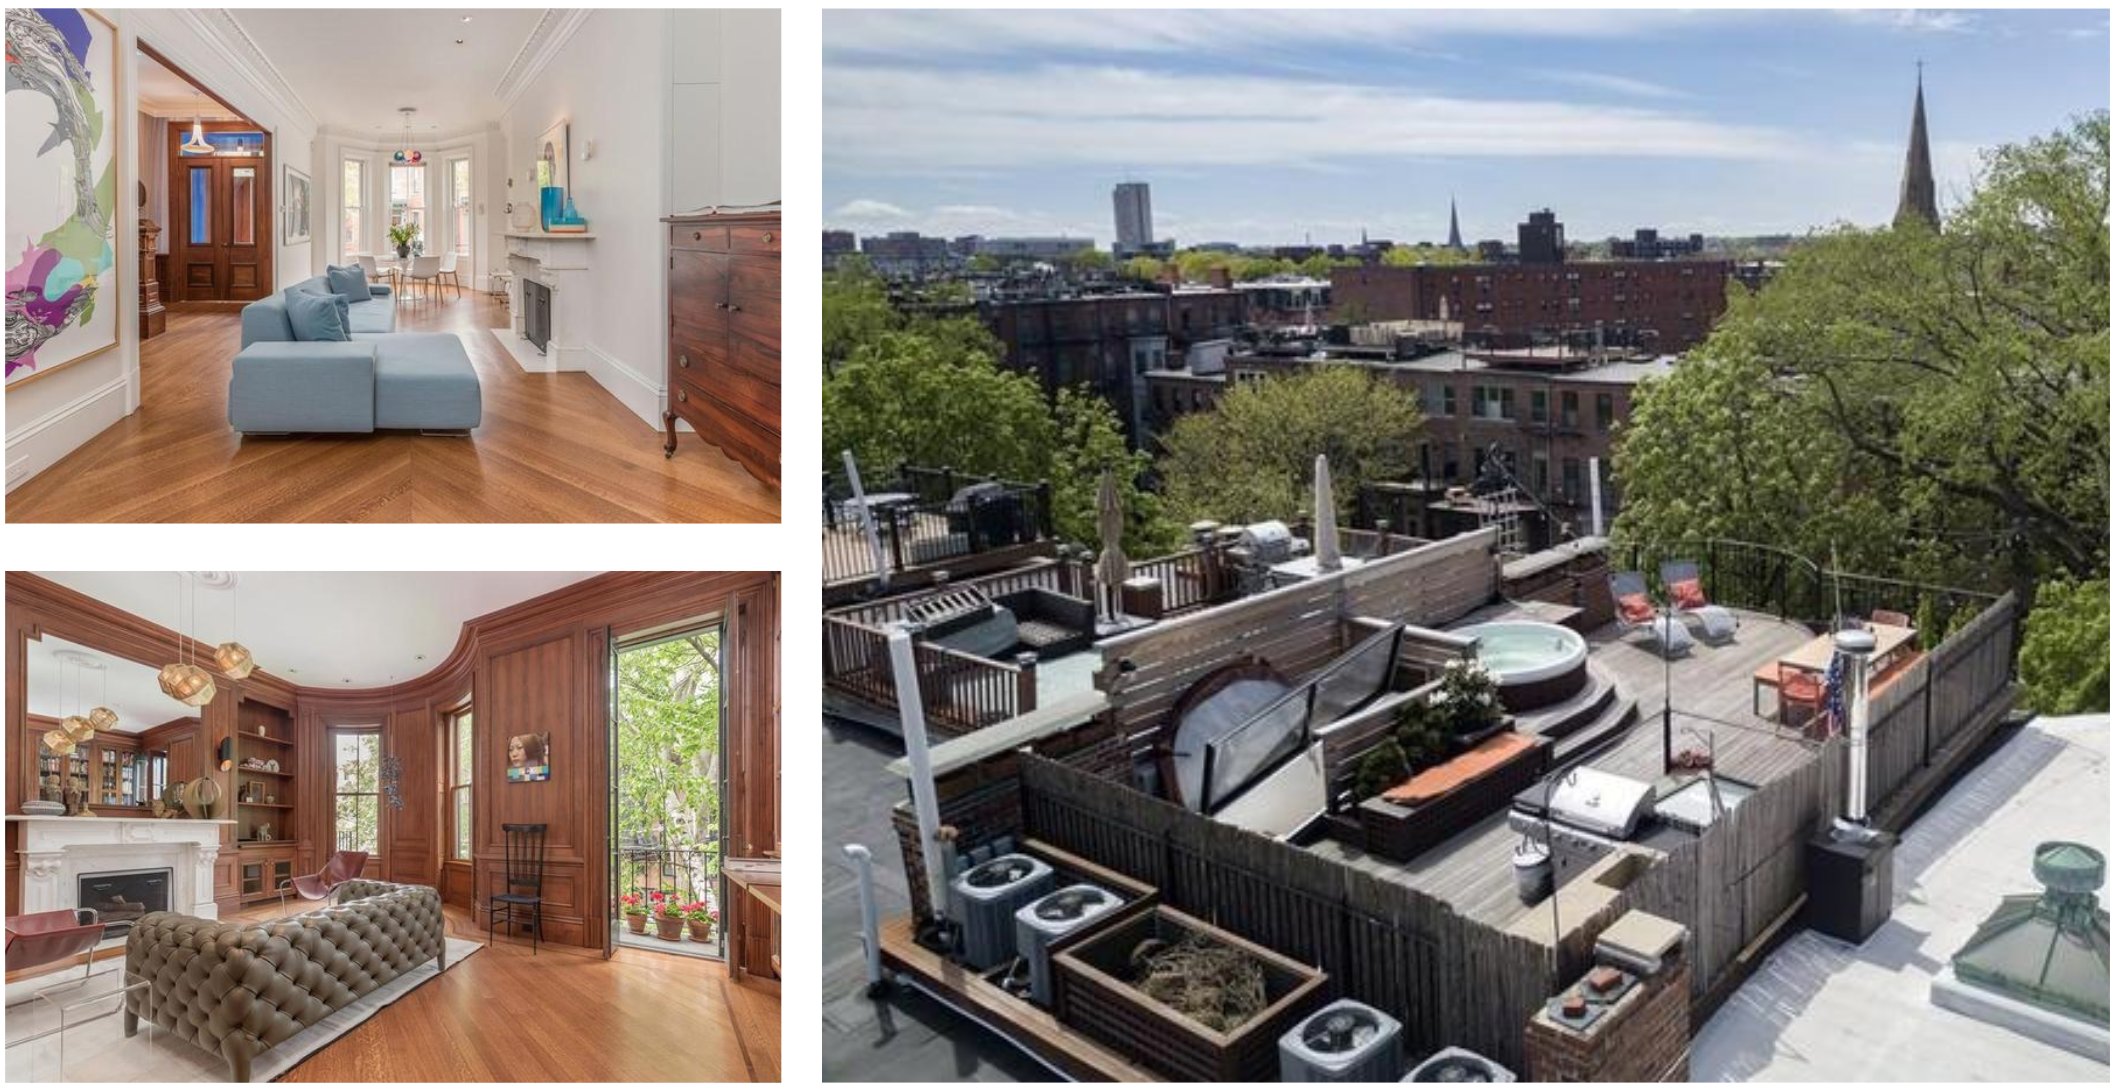
26 Holyoke St:
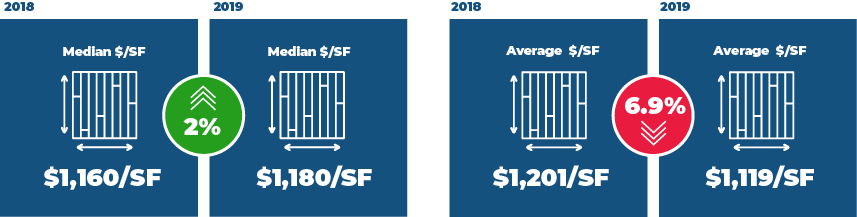
On the positive side, the median price per square foot actually increased year over year ($1,180/SF in 2019 vs. $1,160/SF in 2018). Of course, that was
countered by a slide in the average price per foot from $1,201 in 2018 to $1,119 in 2019. Where does that leave us? Needing more time and data to decipher
this market!
sales data from Jan 1 – May 6 in each year
We still have the bulk of our spring sales season to come. We’ll be watching the results closely. Sellers have pressed pricing up at the higher end of
the market and buyers seem to be resisting those premiums, even for high quality product in “A” locations.
In the next edition of our newsletter we’ll look more closely at the Back Bay.